<– Step 1 Step 3–>
In Step 1, we imported raw data for each player’s performance. We can now assign fantasy points to each player’s performance by week.
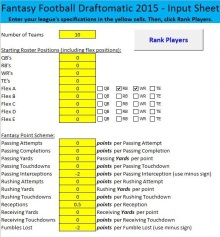
We’ll assume the following fantasy point scheme:
1 Passing_Comp = 0 points
1 Passing_Att = 0 points
20 Passing_Yds = 1 point
1 Passing_Int = -1 point
1 Passing_TD = 4 points
10 Rushing_Yds = 1 point
1 Rushing_TD = 6 points
1 Receiving_Rec = 0.5 points
20 Receiving_Yds = 1 point
1 Receiving_TD = 6 points
1 Fum_Loss = -1 point
Naturally, you will want to use your own league’s fantasy point scheme for your spreadsheet.
Now, it’s simply a matter of good old algebra. (I knew that we would use algebra after high-school; I just knew it!)
First, add the column header, “Fan_Pts”, to the right of your data set.

Figure 2-1
Then, create the following formula under the Fan_Pts header:
=F2/10+I2*6+J2*0.5+K2/20+N2*6-P2
This formula translates the player’s stats into fantasy points, based on the above fantasy point scheme.

Figure 2-2
Now, double click the fill handle. (It’s that little black dot on the lower right of the selected cell.) And, pow! You now have fantasy points by player, for each week of every season. I love that feature!

Figure 2-3
In Step 3, we’ll begin the cool part — PivotTables. With PivotTables, we can convert our data into more useful information. After that, we’ll analyze further, making our way to a cheat sheet that is customized to your league.
<– Step 1 Step 3–>