Draftomatic spreadsheet customers achieved a 76% success rate of getting into the playoffs, last season (2012). Customizing player rankings to customers’ own leagues proved to be powerful. Yet, Value Based Drafting (VBD) still relies on accurate statistical projections.
Fortunately, the Draftomatic’s projections are strong.
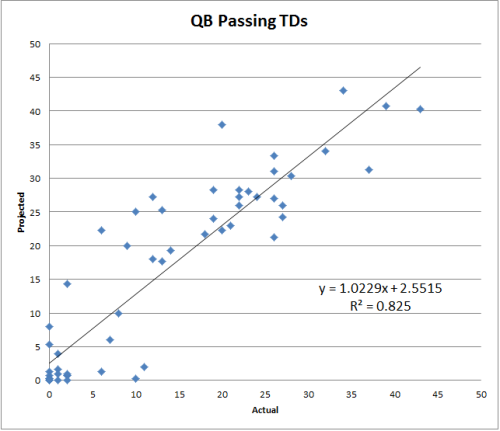
The slope (m) of 1.0229 shows a near perfect one-to-one determination between Projected and Actual Passing TDs. The 0.825 coefficient of determination (R2) indicates a statistically strong relationship.
Okay, that’s enough geek-speak!
Translation: The above chart shows that the Draftomatic’s Passing TD projections were approximately 82% accurate overall.
I have to admit that’s pretty darn impressive. We did not merely predict win or lose. We predicted the precise number of touchdowns each quarterback will throw during the regular season. In fantasy football, whoever is best at predicting the future will win.
It gets even better with QB Passing Yards.
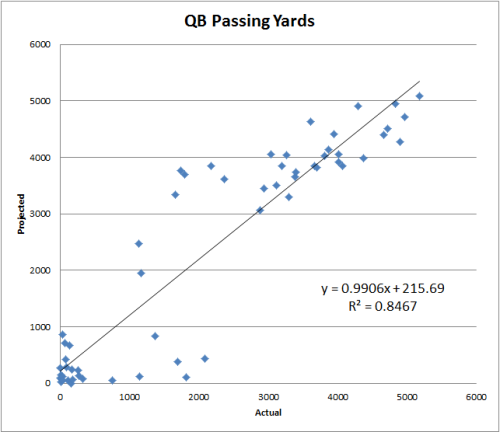
Our Projected Passing Yards are closer to a one-to-one relationship with Actual Passing Yards (m is closer to exactly 1); and the overall accuracy is slightly better (R2 is higher).
Value Based Drafting is inherently at risk of GIGO (Garbage In, Garbage Out). However, the Draftomatic’s strong projections will help keep the garbage away from your player rankings.
Get an email notification, when the Draftomatic 2013 spreadsheet gets released. Just click the “Follow” button on the right-hand sidebar.
Good luck and have a great season!